S&P500
 5 Ocak 2022
S&P500: 4-hourly and daily chart technical view.
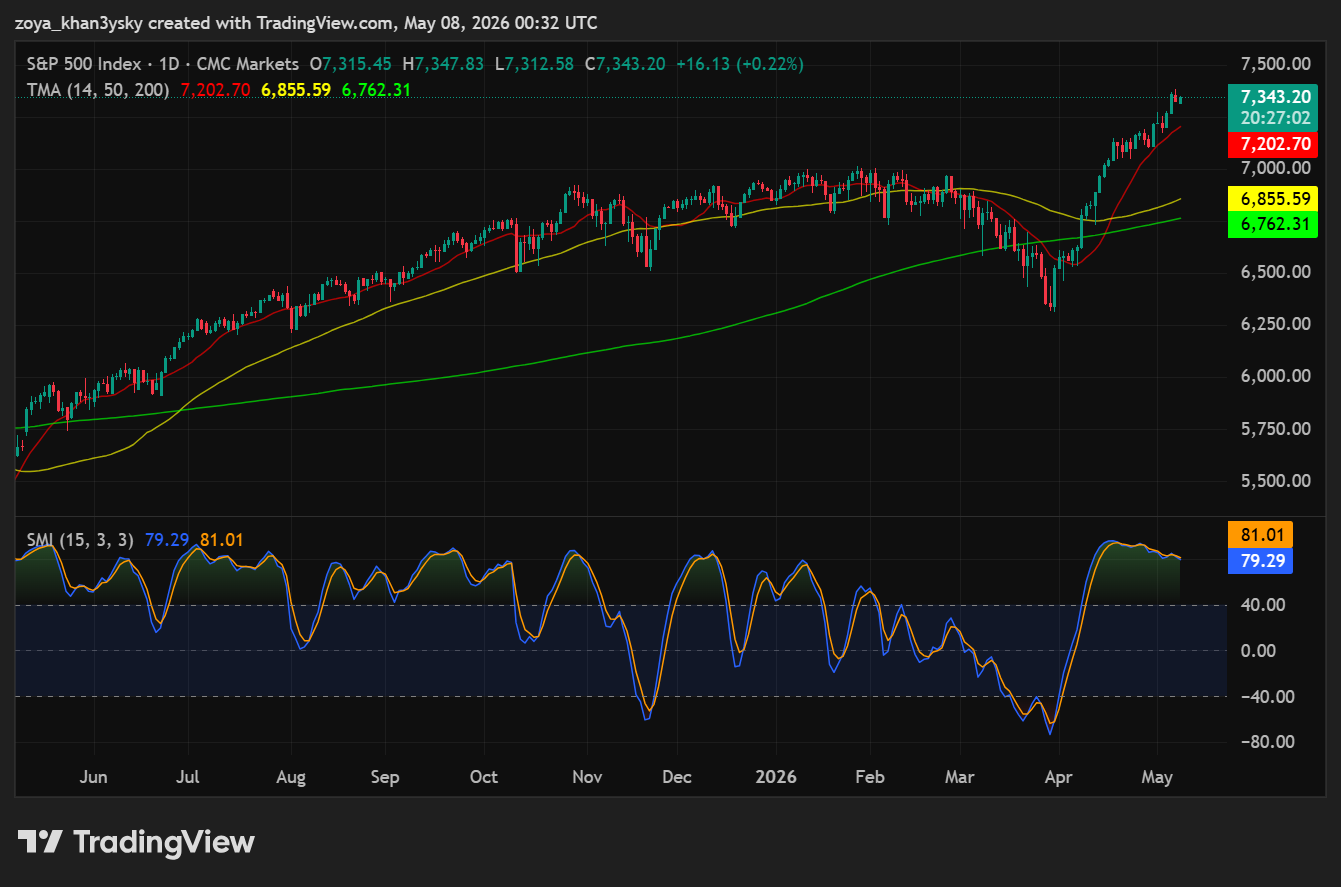
Daily Chart: Longer Term Bias: Bullish
| Resistance |
7,400 then 7,500 |
| Support |
7,203 then 6,856 |
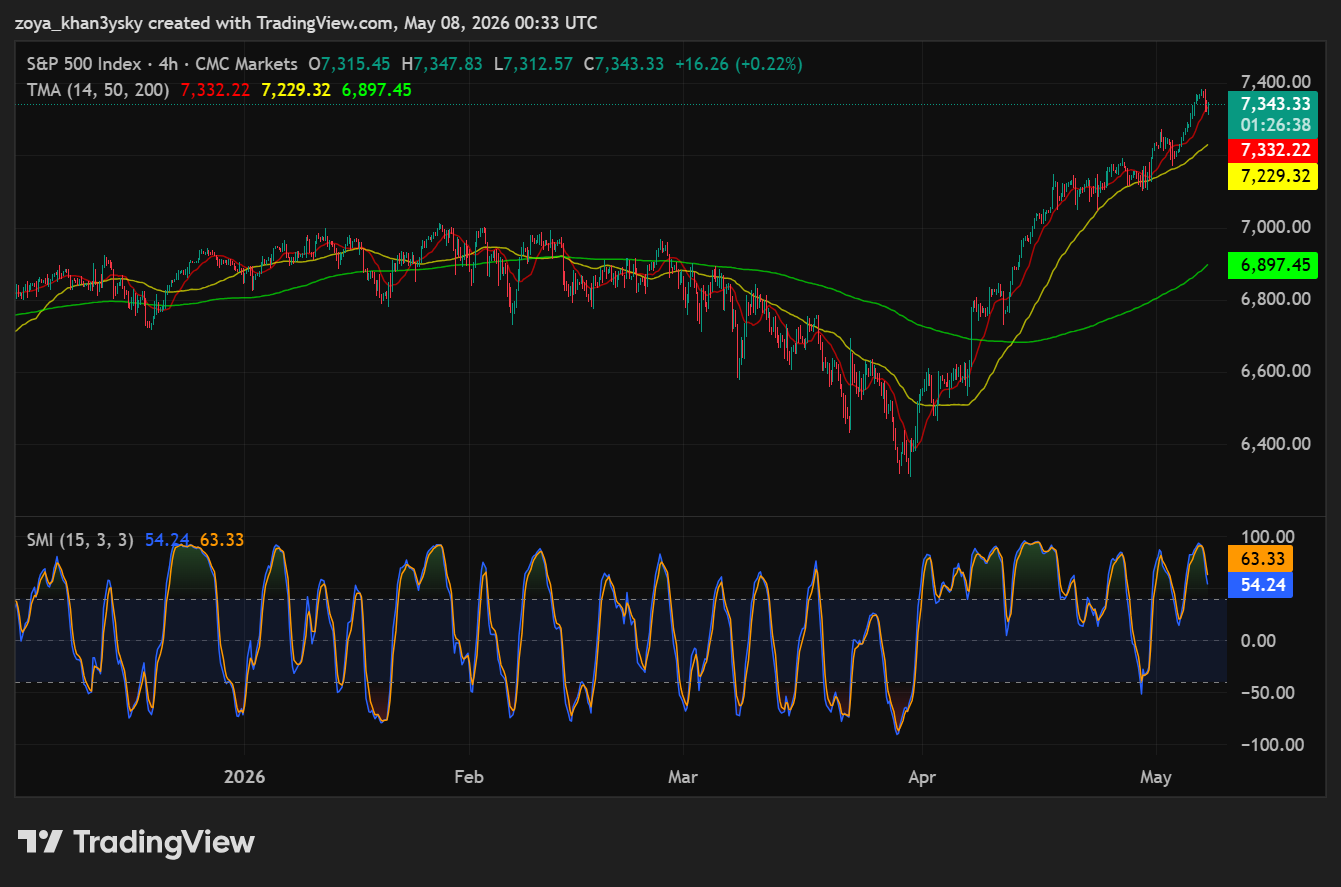
4-Hour Chart: Short-Term Outlook: Bullish
| Resistance |
7,400 then 7,500 |
| Support |
7,332 then 7,229 |
Daily Chart: Longer term Bias: Bullish
4 Hour Chart: Short Term Outlook: Bullish
Friday 8th May
The daily chart for the S&P 500 presents a compelling bullish longer-term bias as price at 7,343.20 has staged one of the most powerful recovery rallies visible on the chart, surging from the April 2026 low near 6,250 back to fresh all-time high territory in a near-vertical price advance that has left all three moving averages comfortably below current price — a textbook bullish moving average stack configuration that confirms broad trend alignment across all measured timeframes. The 14-day moving average (red line) at 7,202.70 is rising steeply and acting as the first dynamic support level traders should monitor, having already provided reliable intraday dip-buying opportunities throughout the May recovery; the 50-day moving average (yellow line) at 6,855.59 is beginning to curl upward after flattening during the March-April correction, signaling that the medium-term trend is re-establishing its upward trajectory, while the 200-day moving average (green line) at 6,762.31 continues its long-term upward slope, confirming the secular bull market structure remains entirely intact — the brief dip toward the 200-day during April’s capitulation and the swift, aggressive rejection of those levels is itself a powerful bullish signal, as it demonstrates institutional buyers view any proximity to the 200-day as an accumulation opportunity rather than a precursor to trend failure. The Stochastic Momentum Index is the most important analytical element on this timeframe, currently reading 79.29 with the signal line at 81.01 — both lines are deep in overbought territory above the 40 threshold, having surged from extreme oversold levels near -60 in early April in a momentum thrust of exceptional magnitude that mirrors the velocity of the price recovery. Critically, the SMI signal line is marginally above the main line and both are beginning to exhibit a subtle flattening at the overbought extreme, which in isolation would suggest caution about near-term upside exhaustion; however, in the context of a powerful trend recovery following a severe correction, momentum oscillators can remain overbought for extended periods as the underlying trend reasserts itself — a phenomenon known as “overbought in an uptrend,” where the signal of overbought conditions should be interpreted as trend confirmation rather than reversal warning. The bullish momentum divergence between the deeply oversold April SMI readings and the subsequent explosive price recovery has now fully resolved in favor of the bulls, and the immediate upside target is the 7,400 resistance level representing the psychological round number ceiling, beyond which the 7,500 level becomes the measured extension objective for the current impulse wave. Traders holding long positions should maintain a stop loss below the 14-day moving average at 7,203, as a daily close below this level would signal that the recovery momentum is faltering and a deeper consolidation toward 6,856 is likely.
Daily Chart: Longer Term Bias: Bullish
4 Hour Chart: Short Term Outlook: Bullish
Minimum Investment Amount and Period
Contrary to popular belief, Lorem Ipsum is not simply random text. It has roots in a piece of classical Latin literature from 45 BC, making it over 2000 years old. Richard McClintock, a Latin professor at Hampden-Sydney College in Virginia, looked up one of the more obscure Latin words, consectetur, from a Lorem Ipsum passage, and going through the cites of the word in classical literature, discovered the undoubtable source. Lorem Ipsum comes from sections 1.10.32 and 1.10.33 of "de Finibus Bonorum et Malorum" (The Extremes of Good and Evil) by Cicero, written in 45 BC. This book is a treatise on the theory of ethics, very popular during the Renaissance. The first line of Lorem Ipsum, "Lorem ipsum dolor sit amet..", comes from a line in section 1.10.32.
This is a premium content
Contrary to popular belief, Lorem Ipsum is not simply random text. It has roots in a piece of classical Latin literature from 45 BC, making it over 2000 years old. Richard McClintock, a Latin professor at Hampden-Sydney College in Virginia, looked up one of the more obscure Latin words, consectetur, from a Lorem Ipsum passage, and going through the cites of the word in classical literature, discovered the undoubtable source. Lorem Ipsum comes from sections 1.10.32 and 1.10.33 of "de Finibus Bonorum et Malorum" (The Extremes of Good and Evil) by Cicero, written in 45 BC. This book is a treatise on the theory of ethics, very popular during the Renaissance. The first line of Lorem Ipsum, "Lorem ipsum dolor sit amet..", comes from a line in section 1.10.32.
Period
Contrary to popular belief, Lorem Ipsum is not simply random text. It has roots in a piece of classical Latin literature from 45 BC, making it over 2000 years old. Richard McClintock, a Latin professor at Hampden-Sydney College in Virginia, looked up one of the more obscure Latin words, consectetur, from a Lorem Ipsum passage, and going through the cites of the word in classical literature, discovered the undoubtable source. Lorem Ipsum comes from sections 1.10.32 and 1.10.33 of "de Finibus Bonorum et Malorum" (The Extremes of Good and Evil) by Cicero, written in 45 BC. This book is a treatise on the theory of ethics, very popular during the Renaissance. The first line of Lorem Ipsum, "Lorem ipsum dolor sit amet..", comes from a line in section 1.10.32.
We are glad you liked it
For your convenience, this will appear under your Saved articles in the top menu.